
Most investors do not lose money in real assets because they picked the “wrong” farm, building, or warehouse.
They lose money because they evaluated the asset with the wrong metric at the wrong time, then believed the story over the math.
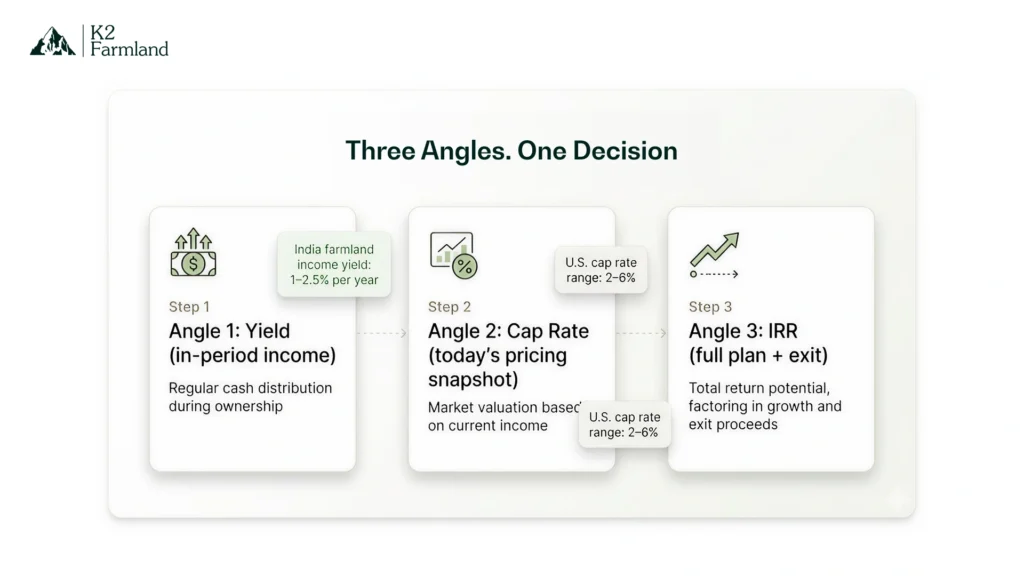
This guide gives you a clean way to evaluate any real asset using yield, cap rate, and IRR, and then applies the same framework to farmland so you can sanity-check projections and ask smarter questions.
The Three Metrics That Let You Compare Any Real Asset
Think of these metrics as three different camera angles on the same investment:
- Yield tells you what you earn each year, relative to what you paid or invested.
- Cap rate tells you what the market is willing to pay for one year of stabilized net operating income.
- IRR tells you the annualized return implied by the full stream of cash flows, including the exit, and the timing of each cash flow.
Used together, they stop you from comparing a “high yield” deal to a “high IRR” deal as if they mean the same thing.
Yield First: What You Earn While You Wait
Yield is your in-period return. It is the cash or net income you receive during the holding period.
In real assets, yield is often discussed in a few common ways:
- Income yield (net income divided by asset value).
- Distribution yield (cash distributed to investors divided by invested equity).
- Cash-on-cash return (annual cash flow divided by the investor’s cash invested).
For farmland, “yield” often comes from cash rent, crop-share, or operating surplus, depending on the structure, and tends to be modest compared to many other asset classes. Farm real estate cap rate commentary from Farm Credit Services of America notes that farmland generally has low cash flow but higher appreciation, and cites typical cap rate ranges.
What to verify before you trust a “yield” number:
- Is it gross or net of all recurring costs?
- Who pays taxes, insurance, maintenance, farm management, and compliance?
- Is it fixed, variable, or price-linked?
Cap Rate Next: Pricing A Real Asset In One Line
Cap rate is one of the simplest, most useful shortcuts in real-asset evaluation.
Definition: The cap rate is typically net operating income divided by the current market value.
Why cap rate matters:
- It lets you quickly compare two assets on an unlevered basis using stabilized income.
- It is the foundation for the income approach to valuation, where value can be expressed as NOI divided by cap rate.
Two practical cap-rate truths most investors learn late:
- Cap rate is a snapshot, not a forecast.
- A lower cap rate is not “bad” in and of itself. It can reflect lower perceived risk, stronger demand, or higher quality income.
IRR Last: The Full Story With Time And Exit
IRR is the discount rate that makes the net present value of all cash flows equal to zero.
Why IRR earns its place in decision-making:
- It incorporates timing, which is where many real asset deals win or lose.
- It forces you to model the exit, not assume it.
Where IRR gets abused:
- When people plug in optimistic exit assumptions without showing the bridge.
- When they show gross IRR but do not clarify fees and costs (net IRR can differ meaningfully).
Cap Rate Vs IRR: When Each Metric Misleads You
Cap rate can mislead you when:
- The income is not stabilized, or large capex is required to achieve it.
- The NOI is being presented before real operating costs.
IRR can mislead you when:
- The exit price is doing all the work.
- Early distributions inflate the headline rate, while the total value is not growing as expected.
A practical discipline:
- Use the cap rate to price “today’s income.”
- Use IRR to test “the full plan,” including what could go wrong.
Now Apply It To Farmland
Here is how the same framework looks when the underlying asset is farmland.
Farmland Yield And Cash Rent
Farmland yield is often expressed in terms of rent. A common approach to estimating farmland cap rates by dividing cash rent by land value per acre.
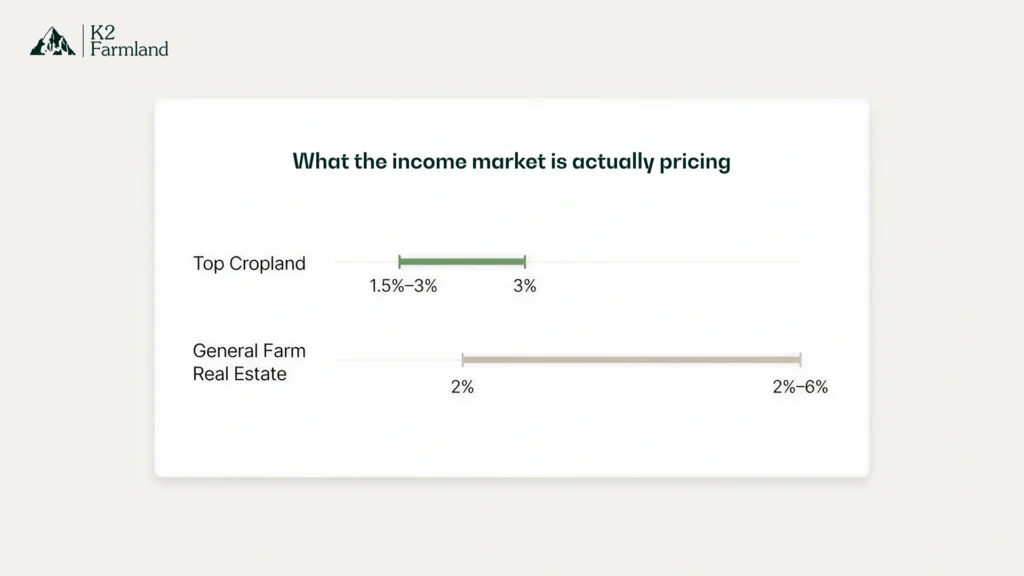
Across markets, cap rates can vary meaningfully. Farm Credit Services of America cites farm real estate cap rates typically ranging from 2% to 6%, depending on location and market dynamics.
Iowa State Extension commentary similarly notes that top cropland can trade in the 1.5% to 3% range in some contexts, with higher cap rates indicating higher risk or weaker demand.
Takeaway: If someone pitches farmland yield that sits far outside observed ranges, the burden of proof is on them.
Farmland Cap Rate In Practice
For a rent-based farmland asset, cap rate logic is straightforward:
Cap Rate = Net Rent (after costs) / Current Land Value
The practical complexity is not the formula, it is the “net”:
- Who pays property taxes and insurance?
- Management and compliance costs.
- Water availability, replanting cycles (for permanent crops), and other capex needs.
If you want a fast quality check, ask for:
- A one-page “NOI bridge” that reconciles gross rent to net distributable income.
IRR For Farmland With A Simple Return Bridge
IRR for farmland usually comes from three drivers:
- Annual net income (yield).
- Value growth (appreciation plus any operational uplift).
- Exit pricing (what cap rate or multiple a buyer will pay).
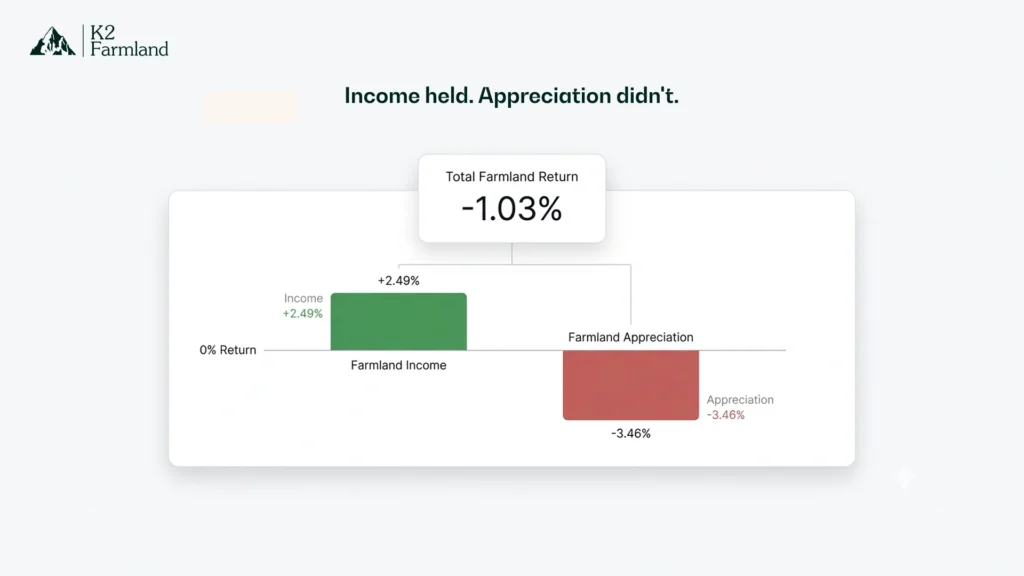
Institutional index data are useful here because they show how returns can be split between income and appreciation. For example, NCREIF’s farmland press releases show rolling income returns remaining positive even when appreciation is negative in certain periods and segments.
A 2025 AgIS Capital report cites the NCREIF Total Farmland Index posting an annual return of -1.03% in 2024, consisting of 2.49% income and -3.46% capital returns.
What that means in plain language:
- Even “good” farmland can have years where the exit value is down.
- If your underwriting depends on appreciation every year, your IRR is fragile.
India Note: Why Yield Is Often Small
If you are evaluating farmland opportunities in India, separate price appreciation from income yield.
IIM Ahmedabad’s ISALPI page notes that the index focuses on capital appreciation and that income yield from crops or farmland rental is usually small, often in the range of 1% to 2.5% per year.
This is exactly why serious farmland underwriting must show:
- How yield is generated and verified.
- What operational changes will realistically improve net income?
- What the exit market will value, and why.
A Simple Underwriting Template You Can Use
Use this mini-template to evaluate any farmland deal, manager, or platform.
Step 1: Lock The Yield Reality
- Show the last 12 months’ net income, then normalize it.
- List recurring costs above the investor distribution.
- State whether income is fixed or variable.
Step 2: Price The Asset With Cap Rate Logic
- Provide stabilized NOI.
- Show implied cap rate at purchase price using NOI divided by value.
- Benchmark against credible ranges in similar farmland contexts.
Step 3: Build The IRR Bridge
- Income cash flows by year.
- Any capex by year.
- Exit year and exit pricing assumption (explicit terminal cap rate or valuation multiple).
- Show IRR gross and net of fees.
Step 4: Run Two Stress Tests
- Exit price 10% lower than the base case.
- Income 20% lower than the base case for two consecutive years.
You do not need perfect precision. You need to see whether the deal survives reality.
How K2 Maps Yield, Operations, And Exit Discipline
K2’s positioning is operator-led farmland investment, designed to reduce investor workload while building measurable asset quality.
K2’s Invest describes acquiring assets, optimizing operations, and entering a long-term lease agreement that provides partners with stable, fixed annual income, while K2 handles operations, compliance, harvesting, and sales.
How that maps to this framework:
- Yield: fixed lease income is designed to make in-period cash flows predictable.
- Cap Rate Discipline: predictable net income makes valuation logic clearer, because the “NOI” is easier to audit.
- IRR Discipline: operational interventions are intended to improve farm efficiency and long-term asset quality, supporting value creation and a more defensible exit story.
If you are in active evaluation mode, a good next step is to request a cash flow bridge and a sample reporting pack, then evaluate them using the template above.
FAQs
What Is IRR For Farmland, In Simple Terms?
IRR for farmland is the annualized rate implied by all cash flows from the investment, including income during the hold and the sale proceeds at exit.
What Is The Difference Between Cap Rate and IRR?
Cap rate is a one-year snapshot of income relative to value, while IRR reflects the full holding-period return, including timing and exit assumptions.
What Is A “Good” Farmland Cap Rate?
It varies by region and risk. Farm Credit Services of America cites typical farm real estate cap rates in the 2% to 6% range, and academic extension commentary notes some top cropland contexts can be closer to 1.5% to 3%.
Why Can Farmland Show Positive Income But Negative Total Return?
Because total return combines income plus appreciation. Institutional farmland data show periods when income returns remain positive while appreciation turns negative.
In India, Why Do People Say Farmland Yield Is Low?
IIM Ahmedabad’s ISALPI materials note that the index focuses on capital appreciation and that projected income yield from crops or rental is usually small, often around 1% to 2.5% per year.
Conclusion
The cleanest way to evaluate any real asset is to start with yield, price it with cap rate logic, then test the full plan with IRR.
If you do this consistently, you stop chasing stories and start comparing investments on what actually matters: durable income, realistic operational assumptions, and a defendable exit.
Key takeaways:
- Yield tells you what you earn during the holding period, reducing pressure to force an early exit.
- Cap rate is the price one year of stabilized NOI relative to asset value, and it is a useful snapshot, not a forecast.
- IRR for farmland is only as honest as its exit and cash-flow assumptions, so demand a clear return bridge and show net of fees.
- Real-world data shows that farmland income can stay positive even when appreciation is negative, so do not underwrite appreciation as guaranteed.
- In India, separate capital appreciation from income yield, because income yield is often small and must be explicitly underwritten.