
Crop yield can look healthy while the soil beneath it is losing structure, carbon, or biological activity. That creates a diligence problem for farmland investors. The most useful soil health metrics combine physical, chemical, and biological indicators, measured from a documented baseline and repeated with the same methods. Soil organic carbon matters, but it cannot independently show whether water enters the soil, roots can penetrate it, or microbial processes are functioning. A reliable assessment therefore reads the soil as a system and connects each indicator to an operational or financial decision.
Key Takeaways:
- A credible soil baseline combines physical, chemical, and biological indicators rather than relying on crop yield or one laboratory result.
- Soil organic carbon is a useful long-term indicator, but it changes slowly and must be interpreted against soil texture, climate, depth, and sampling method.
- Aggregate stability and infiltration reveal whether soil structure can accept water, resist erosion, and support roots during weather stress.
- Soil respiration or carbon mineralization provides a view of biological activity, but temperature and moisture conditions must be recorded for comparison.
- Investors should demand repeatable sampling locations, depths, laboratory methods, dates, and management records before treating a trend as evidence.
- A single high reading is less informative than a consistent multi-year trend connected to water use, input needs, crop stability, and corrective action.
Why Does Soil Health Belong in Farmland Due Diligence?
Soil health affects the operating capacity of farmland, not just its environmental profile. Soil that stores water, cycles nutrients, supports roots, and resists erosion can give an operator more options during dry periods, heavy rainfall, and input-price changes. Degraded soil may require drainage work, organic amendments, erosion control, different machinery, or a longer conversion period before it can support the intended production system.
A function-based view treats soil health as the continued capacity of soil to operate as a living ecosystem. That approach is useful for investors because it focuses on capacity rather than a single season’s output.
A soil assessment should influence acquisition pricing, capital expenditure, crop selection, water planning, and the operating timeline. K2’s farmland evaluation process places soil and water analysis within asset selection and operating due diligence. The investment question is not simply, “Is this soil good?” It is, “Can this soil perform the required functions, what limits it, and what will improvement require?”
Which Soil Health Metrics Matter Most to Investors?
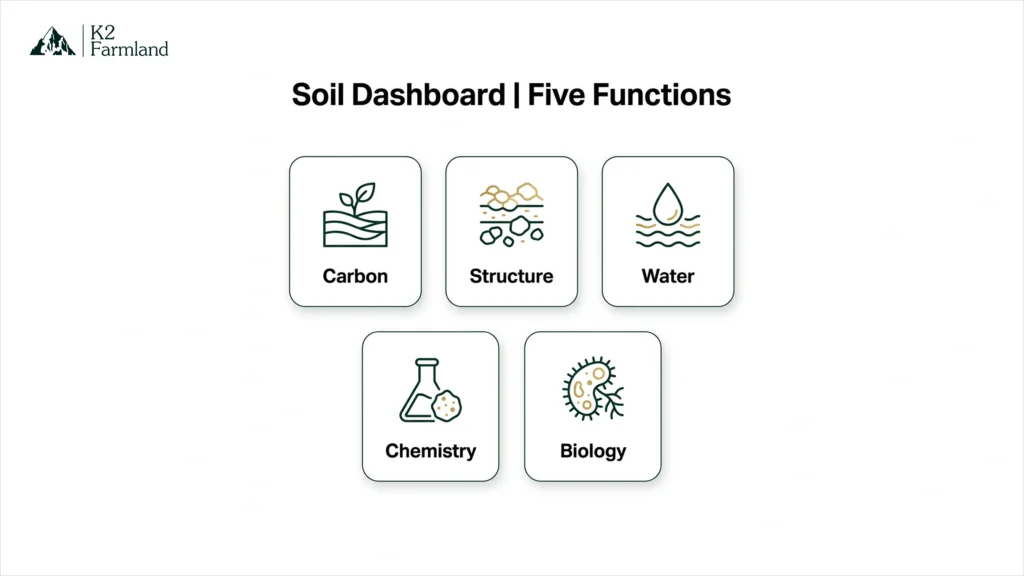
The strongest minimum dashboard covers carbon, structure, water movement, chemistry, and biological activity. The exact test suite should reflect the soil type, climate, crop system, irrigation method, and intended management change.
| Metric | Soil Function It Indicates | Investor Relevance | Main Interpretation Risk |
|---|---|---|---|
| Soil organic carbon | Organic matter dynamics, nutrient and water retention, aggregation | Long-term condition and direction of improvement | Changes slowly and varies with depth, texture, climate, and method |
| Wet aggregate stability | Resistance of soil aggregates to breakdown | Erosion exposure, surface sealing, root habitat, water entry | Methods are not interchangeable |
| Infiltration rate | Speed at which water enters soil | Runoff risk, irrigation performance, drought resilience | Highly affected by current moisture, surface condition, and test location |
| Bulk density or penetration resistance | Compaction and pore space | Root restriction, machinery impact, drainage, rehabilitation cost | Thresholds differ by soil texture |
| pH and electrical conductivity | Acidity, alkalinity, and salinity | Nutrient availability, crop suitability, amendment needs | One composite sample can hide problem zones |
| Soil respiration or carbon mineralization | Microbial activity and carbon cycling | Response to management and biological function | Sensitive to temperature, moisture, storage, and incubation method |
| Available nutrients | Current nutrient status | Input planning and deficiency risk | A fertility test alone is not a soil health assessment |
The 2026 USDA soil health testing technical note explains why multiple indicators are needed and sets out recommended methods for measures such as soil organic carbon, aggregate stability, respiration, pH, and texture. Investors do not need to become soil scientists, but they should require the operator and laboratory to name the method used for every reported indicator.
How Should Investors Interpret Soil Organic Carbon?
Soil organic carbon, or SOC, is a long-term condition metric, not a stand-alone performance score. It is the carbon component of soil organic matter and is connected with structure, biological activity, nutrient supply, water retention, and resistance to erosion.
The difficulty is comparability. SOC results can change with sampling depth, laboratory method, bulk density, stone content, season, slope position, and whether the sample contains inorganic carbon. A result from the top 15 centimeters should not be compared casually with a later sample taken to 30 centimeters. A percentage concentration also does not automatically equal a carbon stock per hectare.
For investment reporting, record:
- Georeferenced sampling locations or a documented sampling grid.
- Sampling depth and the number of cores combined.
- Laboratory method, including any inorganic-carbon correction.
- Bulk density when estimating carbon stocks.
- Crop, residue, tillage, irrigation, and amendment history.
- Date, recent rainfall, and relevant field conditions.
The FAO protocol for soil organic carbon measurement and verification provides a useful framework for consistent monitoring. K2 identifies baseline-versus-annual SOC as part of its agricultural impact framework, but any investor interpretation should still depend on the sampling design and supporting operating records.
What Do Physical Soil Metrics Reveal About Water and Roots?
Physical indicators show whether the soil can accept water, maintain pore space, and let roots explore the profile. These functions can fail even when nutrient results appear acceptable.
Aggregate stability measures how well clusters of soil particles resist disintegration. Stable aggregates help protect pore space and reduce surface sealing and erosion. Infiltration measures how quickly water enters the soil surface. Bulk density and penetration resistance help identify compaction that may restrict root growth or water movement.
These metrics should be read together. Low infiltration may result from weak aggregates, compaction, surface crusting, low ground cover, or a naturally fine-textured horizon. A single ring-infiltration test cannot identify the cause. It should be paired with profile observations, aggregate testing, compaction checks, slope mapping, and drainage history.
This is where soil information connects to asset operations. K2’s farm management model uses diversified systems, soil restoration, and water planning rather than treating land as a passive holding. Investors evaluating similar strategies should ask whether the operating plan addresses the specific physical constraint found in the baseline.
How Should Soil Biology Be Measured?
Biological testing should indicate activity or function, not merely produce a list of organisms. Soil biology includes bacteria, fungi, fauna, roots, and the processes through which organic matter decomposes and nutrients cycle.
Soil respiration measures carbon dioxide released by microbial, root, and faunal activity. Laboratory carbon-mineralization tests standardize part of that process over a defined incubation period. The USDA soil respiration indicator notes that respiration reflects biological activity and decomposition, but it is influenced by temperature, moisture, aeration, organic matter, and recent disturbance.
That sensitivity is both useful and risky. A biological indicator may respond sooner than total SOC after a management change, but inconsistent handling can create an artificial trend. Samples should use the same collection, storage, preparation, incubation, and reporting method.
Microbial diversity tests can add research value, yet they may not translate directly into a clear operating decision. Investors should first ask whether the biological result changes crop selection, residue management, amendment planning, tillage intensity, water management, or the monitoring schedule.
Why Is India’s Soil Health Card a Starting Point Rather Than the Full Picture?
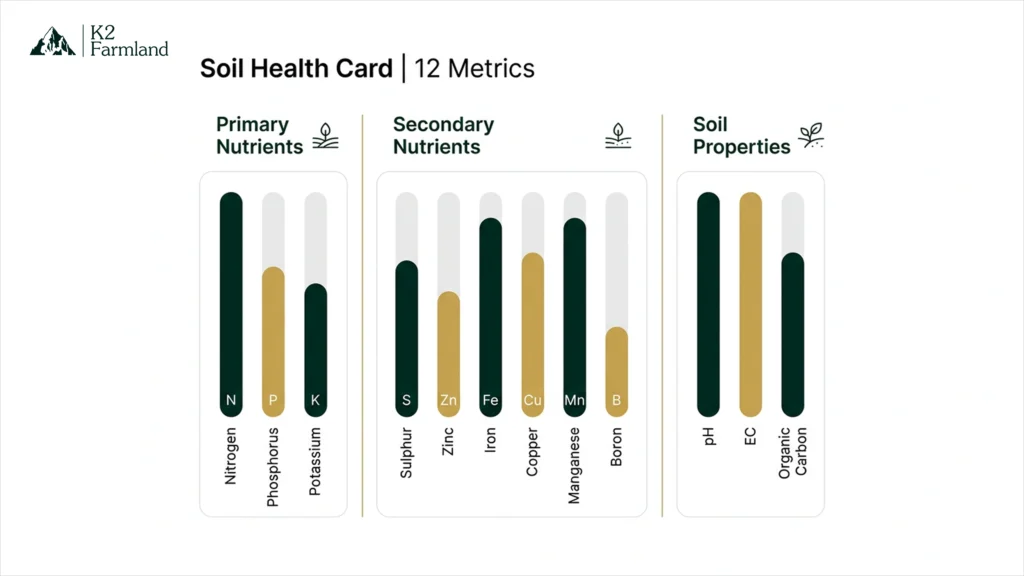
India’s Soil Health Card provides a valuable chemical-fertility baseline, but investor diligence should add physical and biological tests. A February 2025 Press Information Bureau release confirms that the card reports 12 parameters: nitrogen, phosphorus, potassium, sulfur, zinc, iron, copper, manganese, boron, pH, electrical conductivity, and organic carbon.
These parameters help identify nutrient status, acidity or alkalinity, salinity, and organic carbon. The Government of India’s Soil Health Card summary also explains that recommendations are provided for nutrients and soil amendments.
The 12 measures divide into four macronutrients, five micronutrients, and three soil properties. This makes the card useful for fertility management while also showing why a wider investor baseline is needed.
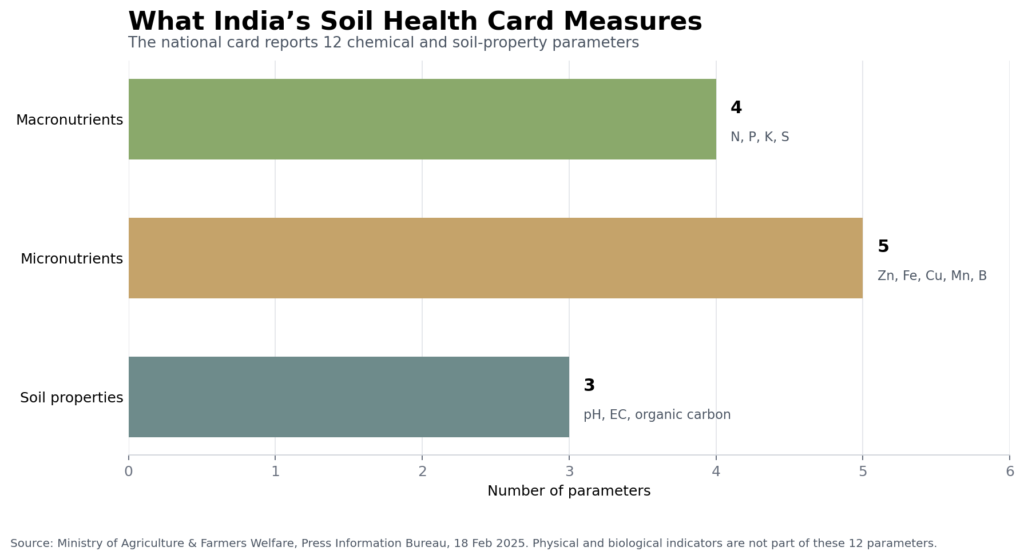
Figure 1. India’s Soil Health Card reports 12 parameters: four macronutrients, five micronutrients, and three soil properties. Source: Ministry of Agriculture & Farmers Welfare, Press Information Bureau, 18 February 2025. The chart is nationally scoped and does not represent the condition of any K2 farm.
For an operator or investor, the card should be treated as one layer of evidence. It does not by itself show aggregate stability, infiltration, compaction, soil depth, drainage behavior, or microbial activity. Those gaps matter when underwriting water resilience, rehabilitation cost, equipment access, and the time needed to change a production system.
India also contains wide variation in soils, rainfall patterns, irrigation conditions, cropping systems, and state-level operating environments. A uniform national threshold should not replace interpretation by a qualified local agronomist or soil scientist.
How Do You Build a Comparable Soil Baseline?
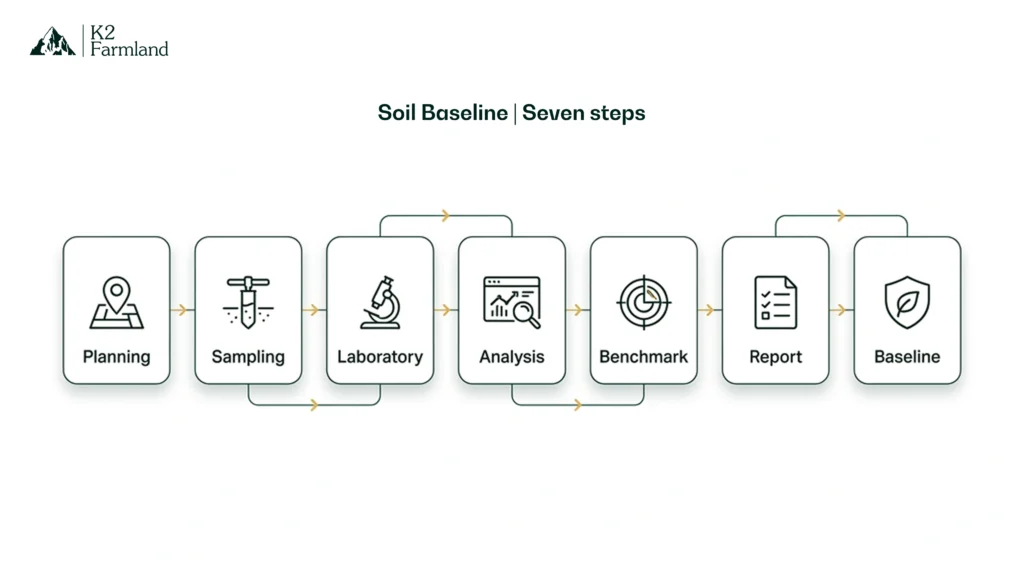
A defensible baseline is a sampling system that can be repeated, not a one-time laboratory report. Before land acquisition or a major management change, the operator should document the field design and create a chain from sample location to decision.
Use this sequence:
- Divide the property into meaningful zones. Separate soil types, slopes, irrigation blocks, cropping history, visible problem areas, and management units.
- Select repeatable points or grids. Record coordinates, depth, number of cores, and composite-sample rules.
- Test all three dimensions. Include physical, chemical, and biological indicators suited to the intended land use.
- Record operating context. Note crop history, fertilizer, amendments, tillage, residue, grazing, irrigation, drainage, and unusual weather.
- Set the comparison interval. Fast-response measures may be checked more frequently than SOC stocks.
- Use the same methods. Keep sampling season, depth, laboratory procedure, and reporting units consistent.
- Connect results to action. Assign each failed or declining indicator an intervention, owner, budget, and review date.
The Soil Health Institute evaluated more than 30 indicators across 124 long-term agricultural research sites in North America when developing its recommended soil health measurements. That work supports a practical lesson for investors in any geography: measurement selection should balance scientific relevance, response to management, cost, and repeatability. Local calibration remains necessary for Indian soils and production systems.
What Can Soil Data Predict, and What Can It Not Predict?
Soil metrics can identify capacity, constraints, and direction of change, but they cannot guarantee yield or investment return. Productivity also depends on weather, crop genetics, pests, water access, labour, machinery, management quality, market access, input costs, and selling prices.
The most decision-useful interpretation is conditional. Improving aggregate stability may reduce erosion exposure and support infiltration, provided surface cover, drainage, and traffic are also managed. A rising biological indicator may show a response to added organic inputs, but it does not prove that the system is profitable. Higher SOC can support several soil functions, yet the pace and feasible level depend on climate, texture, mineralogy, depth, and management history.
Investors should therefore avoid converting soil scores directly into a valuation premium without an operating bridge. The bridge should show the diagnosed constraint, intervention, cost, expected agronomic response, monitoring method, and the financial assumption affected. If those links are absent, the soil report is descriptive rather than investment-ready.
What Are the Red Flags in Soil Health Reporting?
The largest reporting risk is a trend built from non-comparable samples. A polished dashboard cannot repair inconsistent field methods.
Watch for these red flags:
- A claim of improvement without baseline locations, dates, depths, or methods.
- SOC percentages compared across different laboratories or testing procedures.
- Carbon concentration presented as carbon stock without bulk-density data.
- One composite sample used to represent a large or visibly variable property.
- Soil fertility results presented as a complete soil health assessment.
- Biological results reported without moisture, temperature, storage, or incubation details.
- A higher reading described as better without soil-type or crop-system context.
- Yield gains attributed to soil health when weather, irrigation, crop, and input changes also occurred.
- Environmental improvement translated directly into financial return without cost and revenue evidence.
- Farm-level claims without independent verification or access to supporting records.
K2’s article on groundwater recharge and water percolation illustrates why connected measurement matters. Water structures, soil cover, aggregation, infiltration, and percolation affect different parts of the system. Reporting only the existence of a pond or only an infiltration result would leave the investor with an incomplete view.
Which Questions Should Investors Ask?
Investors should ask whether the soil data can be repeated, explained, and converted into action. The following questions expose gaps quickly:
- Which physical, chemical, and biological functions were assessed?
- How were sampling zones selected, and can the same points be sampled again?
- Are depth, season, laboratory method, and units consistent across periods?
- Which indicators are inherent properties, and which are expected to respond to management?
- What constraint does each intervention address?
- What capital expenditure and operating cost are attached to the soil plan?
- Which metric should respond first, and which may take several years?
- How are weather, crop changes, irrigation, and amendments recorded?
- Who reviews the results and approves corrective action?
- Which claims are independently verified, and what limitations remain?
For a wider view of how soil restoration fits within diversified production, read K2’s comparison of monoculture and agroforestry in India. The appropriate soil dashboard should follow the operating system being evaluated, not a generic checklist detached from crop and land-use decisions.
FAQs
What Are the Most Important Soil Health Metrics?
The most important soil health metrics cover soil organic carbon, aggregate stability, infiltration, compaction, pH, salinity, nutrient status, and biological activity. The final suite should be adjusted for soil type, climate, crop system, irrigation, and the management change being evaluated.
Is Soil Organic Carbon the Best Measure of Soil Health?
Soil organic carbon is one of the strongest long-term indicators, but it is not a complete measure of soil health. It changes slowly and should be interpreted alongside physical structure, water movement, chemistry, and biological activity.
How Often Should Soil Health Be Tested?
Testing frequency should match how quickly each indicator can change and the decision it supports. Fast-response biological or surface-condition measures may be checked more often, while SOC trends usually require consistent multi-year monitoring. Use the same season, depth, and method for comparisons.
Can Soil Health Metrics Predict Crop Yield?
Soil metrics can indicate productive capacity and constraints, but they cannot predict yield on their own. Weather, water, crop genetics, pests, labour, machinery, and management also affect output.
What Does Aggregate Stability Tell an Investor?
Aggregate stability indicates how well soil structure resists breakdown under water or physical stress. It can help assess erosion exposure, surface sealing, pore protection, root habitat, and potential water-entry problems.
Why Measure Soil Respiration?
Soil respiration provides evidence of biological activity and organic-matter decomposition. It is sensitive to temperature, moisture, handling, and recent inputs, so comparisons require a standard procedure and recorded test conditions.
Is India’s Soil Health Card Enough for Farmland Due Diligence?
India’s Soil Health Card is a useful chemical and nutrient baseline, but it is not enough for full farmland due diligence. Investors should add physical measures such as infiltration and compaction, plus a suitable indicator of biological activity.
Can Better Soil Health Increase Farmland Value?
Better soil function may support productivity, water resilience, lower erosion exposure, or more operating flexibility, but it does not automatically create a valuation premium. Any valuation effect should be supported by operating records, costs, income assumptions, market evidence, and repeatable soil data.
Conclusion
Soil data becomes investment evidence only when it is comparable and connected to decisions. Start by defining the production system and mapping the property into meaningful zones. Build a baseline across physical, chemical, and biological functions. Then link each constraint to an intervention, budget, responsible operator, monitoring interval, and limitation.
The first professional input worth obtaining is not a generic soil score. It is a sampling and interpretation plan designed by a qualified local agronomist or soil scientist for the property’s soil, climate, water system, and intended crops. Investors can then assess whether the operating plan is improving the land’s functional capacity rather than merely generating attractive numbers.
For a low-commitment next step, review K2’s measurement-led impact approach and use the investor questions above when evaluating a farmland opportunity.